Executive Dashboard Microsoft Excel
01Context
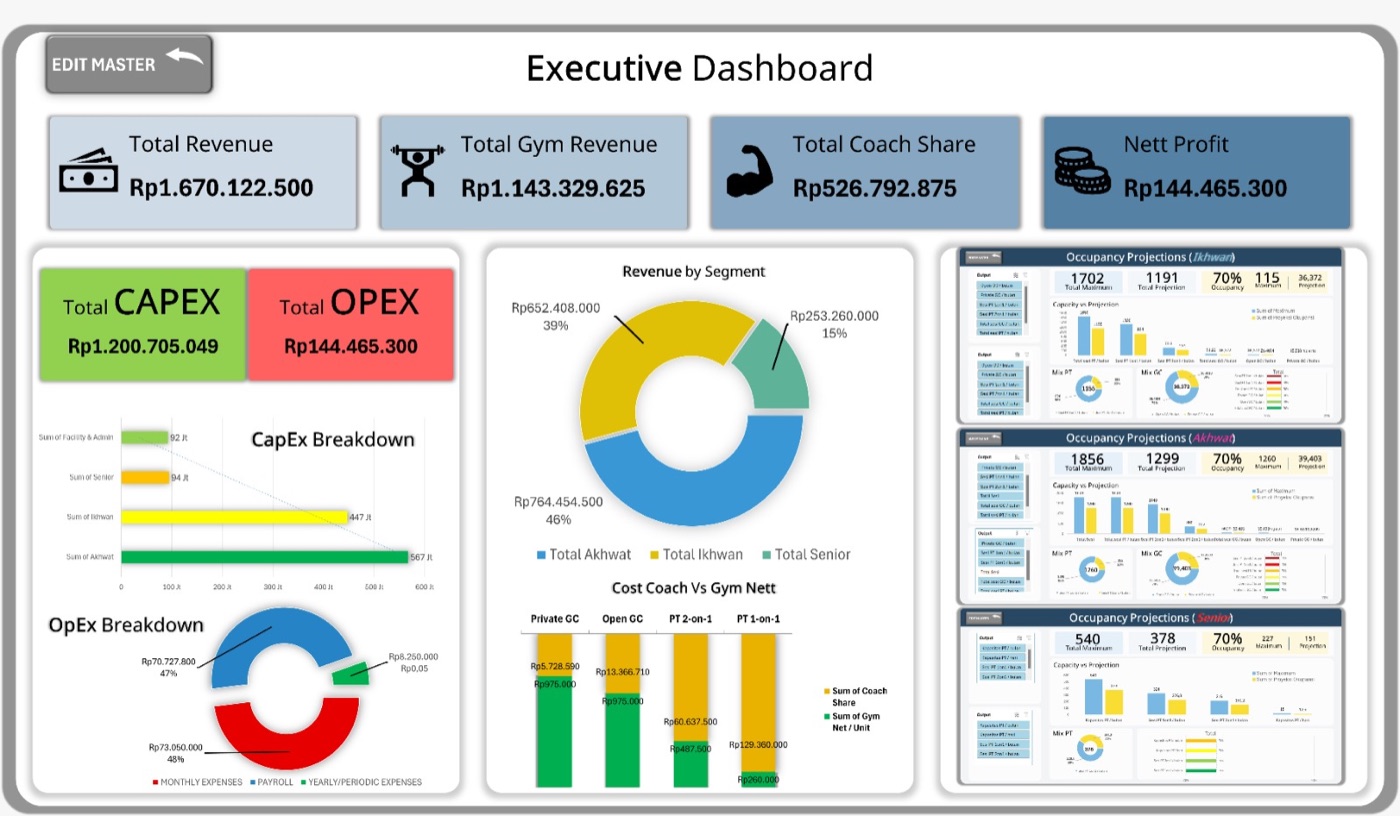
A freelance request to turn a fitness studio's raw business numbers into a dashboard the owner could use when pitching to investors and partners — revenue, cost structure, and capacity, all in one view.
02What it covers
1Revenue breakdownTotal revenue, gym revenue, coach share, and net profit as KPI cards.
2CapEx / OpExCapital and operating expense totals, broken down by category.
3Revenue by segmentAkhwat, Ikhwan, and Senior classes, as a share of total revenue.
4Occupancy projectionsCapacity vs. projection for each segment, with a live occupancy rate.
03Tools & method
Built entirely in Microsoft Excel: Pivot Tables and Pivot Charts for the breakdowns, conditional formatting for the KPI cards, and slicers so the owner can filter by segment without touching a formula.
04Where this stands
This was built for a pitch, not yet measured against a live result — there's no "before vs. after" to report here, unlike the Hafalan or ISO case studies. It's included as evidence of the method: turning raw numbers into something a non-technical owner can read and act on in a meeting.